The key point of combined analysis of miRNA, mRNA and degradomics is the results of tumor degradation analysis. The miRNA sequence used in tumor degradation analysis is all the miRNA, identified by mRNA sequencing. The database compared with the database is the sequence obtained by transcriptome sequencing. The relationship pair information between miRNA and target genes can be obtained by degradation sequencing. Then through the miRNA- target gene network regulation map, we can directly show that miRNA regulates multiple target genes and the same target gene is regulated by multiple miRNA. Through the integrated analysis of these three data, we can explore the regulatory mechanism involved in the process of tumor gene expression.
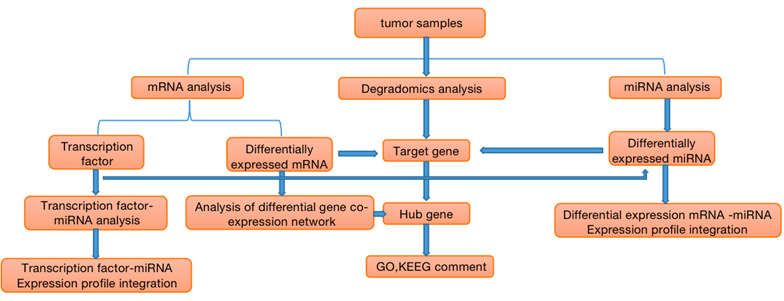 Figure 1. Flow chart of correlation analysis of miRNA, mRNA and Degradomics
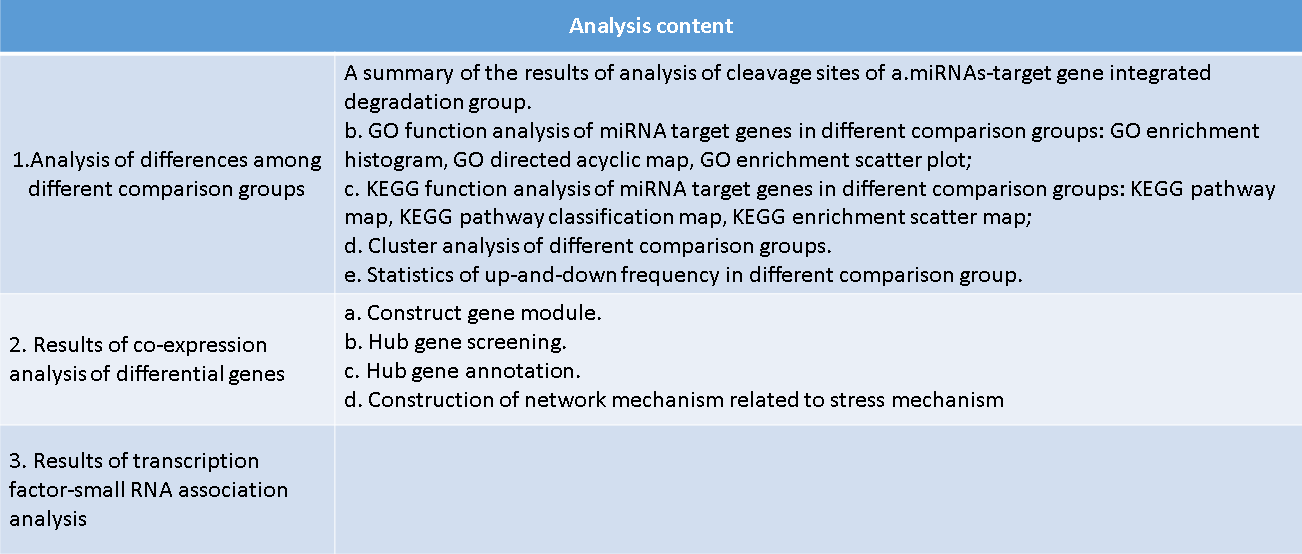
1. General table.
2. Two sub-tables, difference or non-difference.
3.Statistics of up-and down-regulation frequency
of miRNAs-target genes.
4. Cluster analysis of miRNAs-target genes.
5.GO enrichment analysis.
6.KEGG enrichment analysis
The purpose of our research.
1. Obtaining the "panorama" of the expression profile is beneficial to the omni-directional analysis and study of the expression of miRNA, mRNA and Degradomics in tumors.
2. Mining common and unique sequence analysis among tumor samples;
3. Compared with related databases, classification annotation non-coding RNA;
4. Analysis and mapping of degradation sites, functional annotation (GO, KEGG) and enrichment analysis of miRNA target genes
Our Advantage
- A team of experts with decades of experienc
- Powerful Bioinformatics Analysis Technology
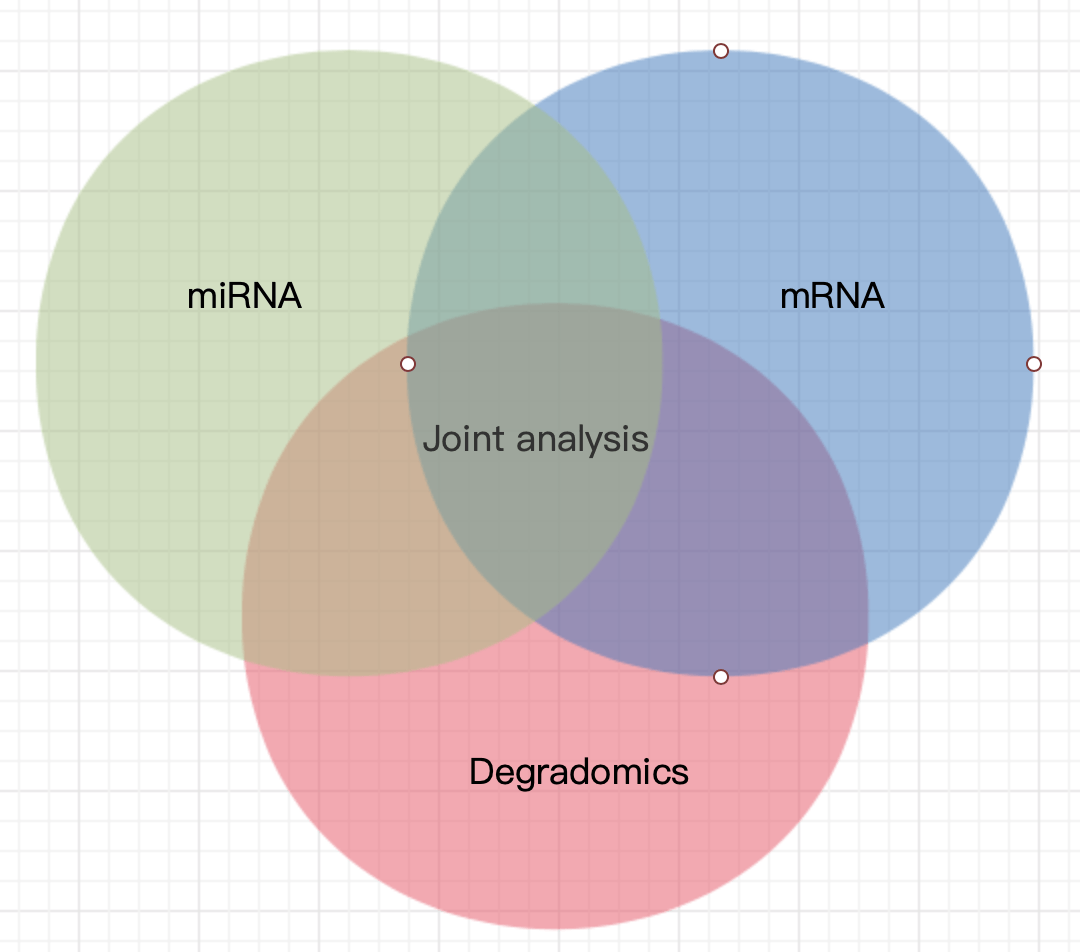
- Joint analysis, mutual confirmation, enhance the persuasive power of the results
- To provide a comprehensive basis for the realization of accurate medical treatment.
- High quality service, high level of experiment, reliable analysis
GO enrichment histogram.
Among all the selected miRNA target genes, the corresponding GO of these genes is annotated as follows.Molecular Function, Biological Process and Cellar Component.It is divided into three categories, and the GO function in each category is changed from the number of target genes annotated to.Sort from high to low, and map, Abscissa is the classification of GO, ordinate is the target base. Because of the percentage, the target genes annotated to the same GO can be seen visually.
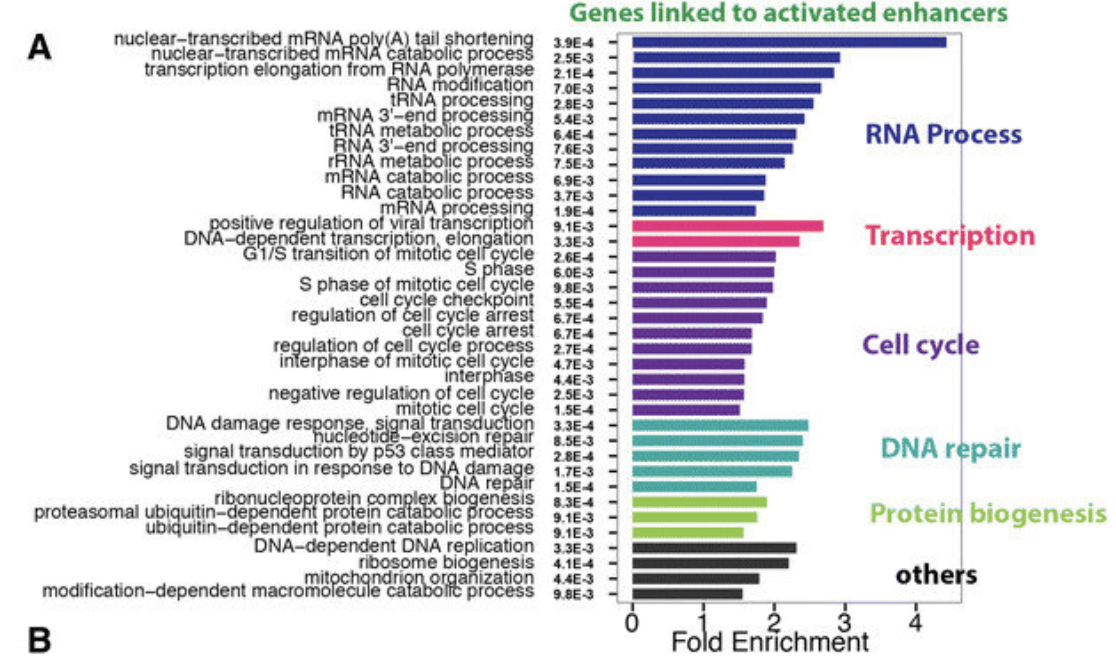 Gene Ontology (GO) enrichment analysis for genes identified in more than one cancer type. (Yao L, et al. 2015)
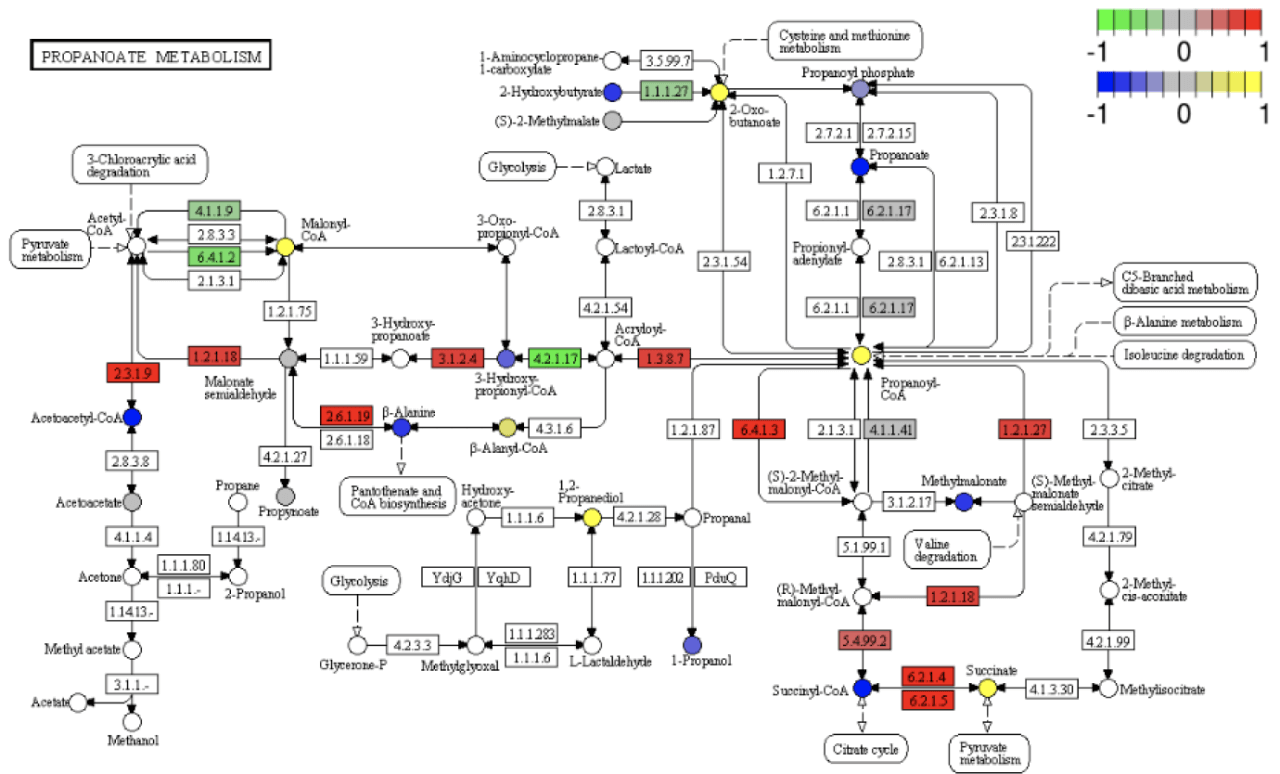
KEGG pathway diagram
Display and description of Pathway road map: red indicates that it is annotated to a certain ko node and is up-regulated.Genes that are significantly differentially expressed. Blue or purple represent those that are annotated to a ko node and down-regulated. Author of differentially expressed genes. The four digits in the box indicate the EC numbers of various enzymes; hollow circle. Circles represent small molecular compounds; solid arrows indicate the direction of biochemical reactions; dotted arrows connect.
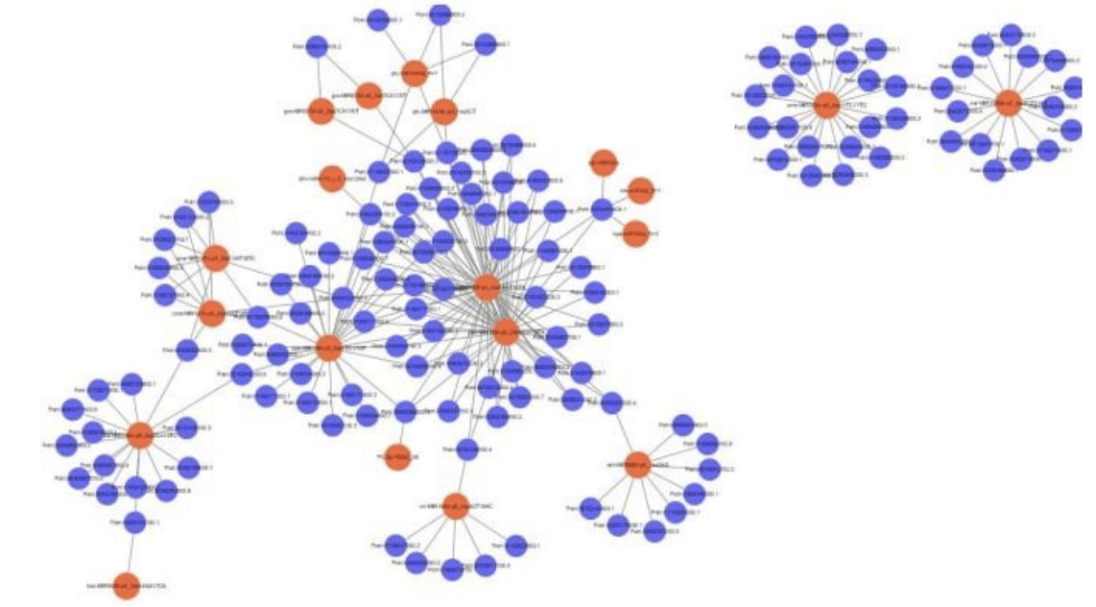
Network Regulation Analysis of miRNA-mRNA.
MiRNA- target gene network regulation map can directly show that miRNA regulates multiple target genes and the same target gene is regulated by multiple miRNA. Researchers can determine the miRNA- target gene pairs of concern according to their own research needs for follow-up experimental verification.
Sample type.
Cell, tissue, body fluid, serum, plasma, whole blood, total RNA, etc.
It is recommended that the starting dose of total RNA should be 60 μg, the minimum 30 μg, and the concentration ≥400 ng/ μL.
Sampling Kit: we provide our customers with a complete sampling kit, including protein and RNA separation kits, as well as tools for storing samples.
Deliverables: raw sequencing data, pruning and stitching sequences, quality control report results, statistics and bioinformatics reports you specify, visual pictures.
Reference
1. Yao L, Shen H, Laird P W, et al. (2015). "Inferring regulatory element landscapes and transcription factor networks from cancer methylomes." Genome biology, 16(1): 105.
* For Research Use Only. Not for use in the treatment or diagnosis of disease.
Related Services: